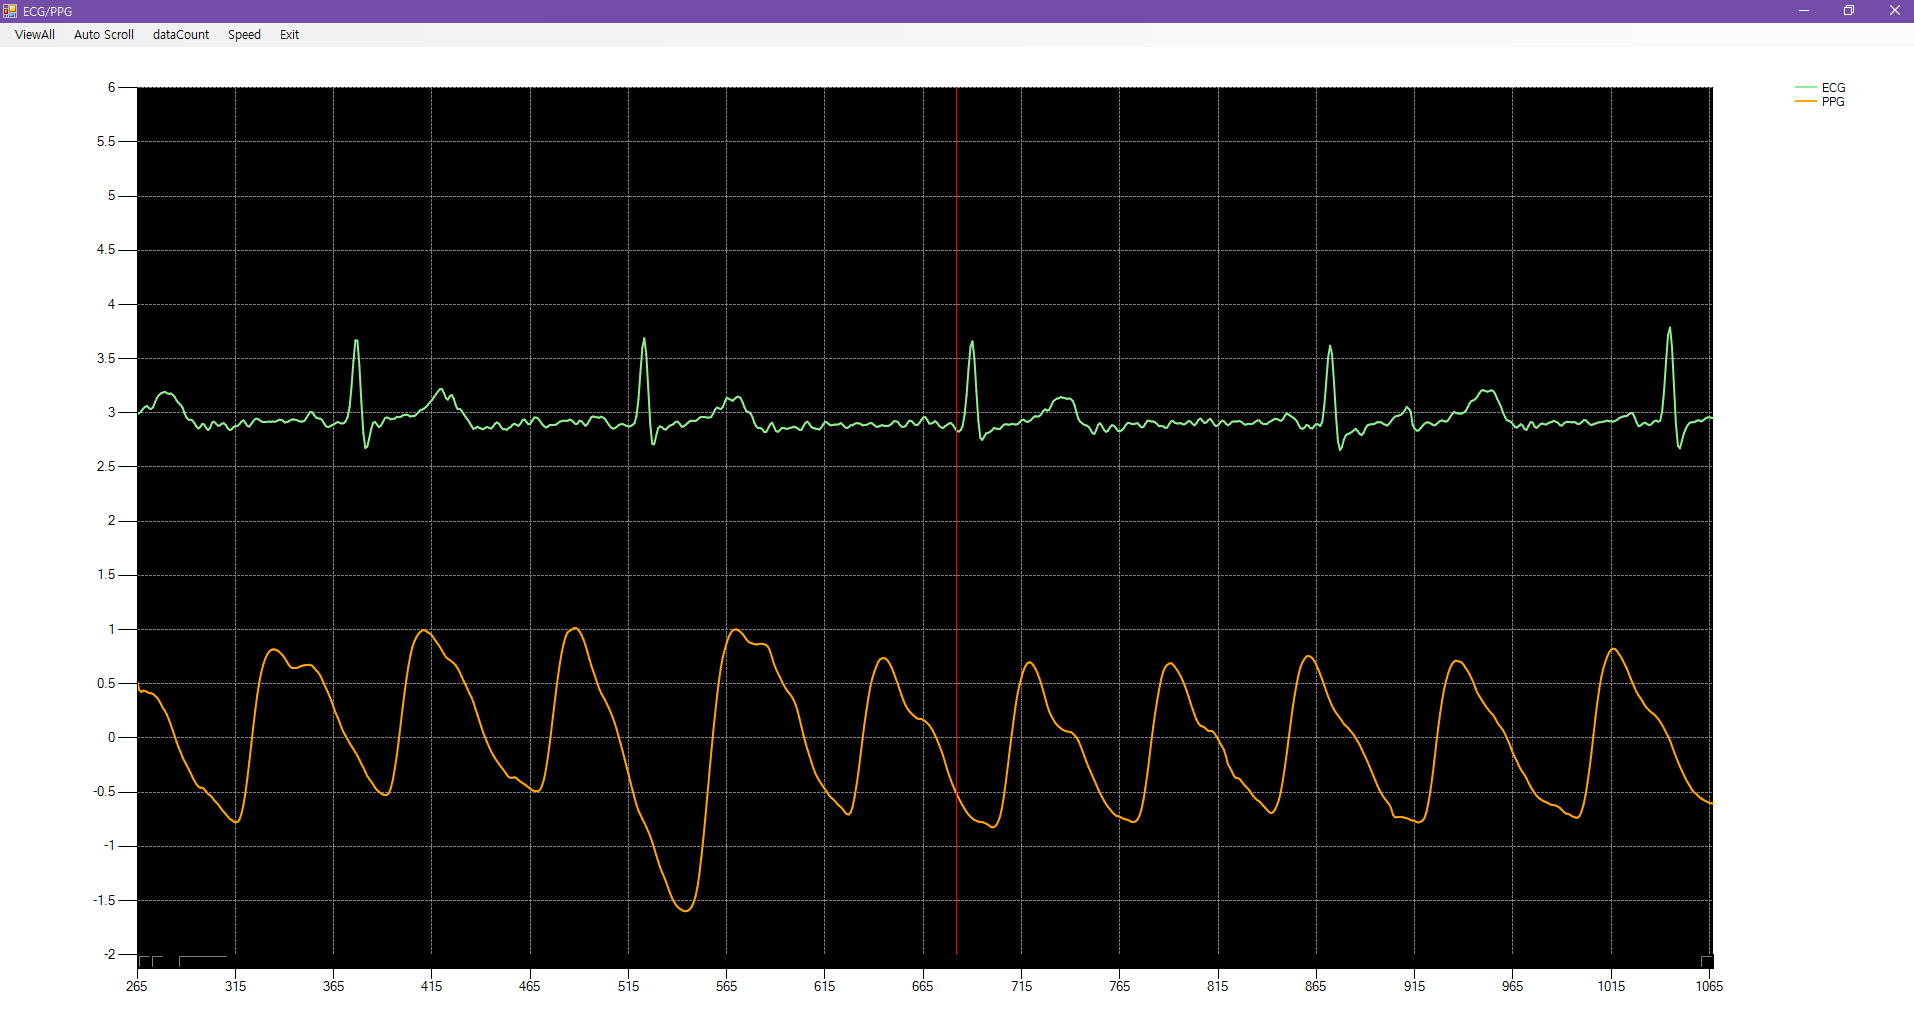
Chart를 조작할수있게 만들어보자
ECG는 정해진 시간에 심장의 전기적 활동을 해석하는 것이다. (심전도)
PPG는 맥파형은 피부표면 혈관의 미세혈관안의 혈류량의 변화상을 통해 혈관에 대한 임상 정보를 제공한다.
	double[] ecg = new double[100000];
        double[] ppg = new double[100000];
        private int ecgCount;
        private int ppgCount;
        Timer t = new Timer();
ecg / ppg 의 배열의 크기를 10만개 지정; 사실 데이터의 개수가 10만개 까지는 아님.
Timer를 통해 AutoScroll 조작예정
	    InitializeComponent();
            this.Text = "ECG/PPG";
            this.WindowState = FormWindowState.Maximized; //창 최대화

            EcgRead();
            PpgRead();
            ChartSetting();

            t.Interval = 10;  // 0.01초
            t.Tick += T_Tick;
생성자 함수 밑에 폼의 이름 지정. 그리고 창 최대화를 위해 세팅.
EcgRead() 함수,PpgRead()함수,ChartSetting()함수를 만들어두고 ALT+ENTER로 함수를 만들어준다.
timer의 interval은 0.01초로 지정.
private void PpgRead()
        {
            string fileName = "../../Data/ppg.txt";
            string[] lines = File.ReadAllLines(fileName);

            double min = double.MaxValue;
            double max = double.MinValue;

            int i = 0;
            foreach (var line in lines)
            {
                ppg[i] = double.Parse(line);
                if (min > ppg[i])
                    min = ppg[i];
                if (max < ppg[i])
                    max = ppg[i];
                i++;
            }
            ppgCount = i;
            string s = string.Format("PPG: count = {0}, min = {1}, max = {2}",
                ppgCount, min, max);
            MessageBox.Show(s);
        }

 private void EcgRead()
{
    string fileName = "../../Data/ecg.txt";
    string[] lines = File.ReadAllLines(fileName);

    double min = double.MaxValue;
    double max = double.MinValue;

    int i = 0;
    foreach (var line in lines)
    {
        ecg[i] = double.Parse(line) + 3; //+3 해서 그래프를 따로 보기위함
        if (min > ecg[i])
            min = ecg[i];
        if (max < ecg[i])
            max = ecg[i];
        i++;
    }
    ecgCount = i;
    string s = string.Format("ECG: count = {0}, min = {1}, max = {2}",
        ecgCount, min, max);
    MessageBox.Show(s);
}
데이터 셋을 프로젝트의 같은 파일안에 Data라는 파일을 만들어주고 txt파일을 넣어준다.
using IO; 필수.
그 파일의 값을 lines배열에 몽땅 넣어준다.
값을 찾기위해 min에는 maxvalue를, max에는 minvalue를 넣어 값을 탐색하게 한다.
값 하나하나를 탐색해 최대값과 최소값을 찾아낸다. 그리고 MessageBox를 통해 값을 출력
Ecg /Ppg 함수 둘다 동일.
private void ChartSetting()
        {
            c.ChartAreas[0].CursorX.IsUserEnabled = true; // 커서 사용가능
            c.ChartAreas[0].CursorX.IsUserSelectionEnabled = true; // zoom
            c.ChartAreas[0].BackColor = Color.Black;

            c.ChartAreas[0].AxisX.Minimum = 0;
            c.ChartAreas[0].AxisX.Maximum = ecgCount;
            c.ChartAreas[0].AxisX.Interval = 50; //50개의 데이터마다 새로운 눈금을 그림
            c.ChartAreas[0].AxisX.MajorGrid.LineColor = Color.Gray;
            c.ChartAreas[0].AxisX.MajorGrid.LineDashStyle = ChartDashStyle.Dash;

            c.ChartAreas[0].AxisY.Minimum = -2;
            c.ChartAreas[0].AxisY.Maximum = 6;
            c.ChartAreas[0].AxisY.Interval = 0.5;
            c.ChartAreas[0].AxisY.MajorGrid.LineColor = Color.Gray;
            c.ChartAreas[0].AxisY.MajorGrid.LineDashStyle = ChartDashStyle.Dash;

            c.Series.Clear();  // 시리즈를 다 지운다
            c.Series.Add("ECG");
            c.Series.Add("PPG");

            c.Series[0].ChartType = SeriesChartType.Line;
            c.Series[0].Color = Color.LightGreen;
            c.Series[0].BorderWidth = 2;
            c.Series[0].LegendText = "ECG";

            c.Series[1].ChartType = SeriesChartType.Line;
            c.Series[1].Color = Color.Orange;
            c.Series[1].BorderWidth = 2;
            c.Series[1].LegendText = "PPG";

            // 데이터를 시리즈에 넣는 작업
            foreach (var v in ecg)
            {
                c.Series["ECG"].Points.Add(v);
            }

            foreach (var v in ppg)
            {
                c.Series["PPG"].Points.Add(v);

            }
        }
private int cursorX = 0; // 차트에 표시되는 첫번째 데이터
private bool scrolling = false; // true이면 스크롤, false이면 정지
private int dataCount = 50; // 한 화면에 표시되는 데이터
private int speed = 2; // 데이터 표시 속도주석참고하여 이해하도록하자.
private void T_Tick(object sender, EventArgs e)
{
if (cursorX + dataCount <= ecgCount)
c.ChartAreas[0].AxisX.ScaleView.Zoom(
cursorX, cursorX + dataCount);
else
t.Stop();
cursorX += speed;
}틱 함수. cursorX 의 값과 dataCount의 값이 ecgCount(최대값) 보다 작으면 줌 가능하게 지정
넘어가면 줌불가 및 멈춤.
private void viewAllToolStripMenuItem_Click(object sender, EventArgs e)
{
t.Stop();
c.ChartAreas[0].AxisX.ScaleView.Zoom(0, ecgCount);
scrolling = false;
}
private void exitToolStripMenuItem_Click(object sender, EventArgs e)
{
this.Close();
}
private void autoScrollToolStripMenuItem_Click(object sender, EventArgs e)
{
t.Start();
scrolling = true;
}ViewAll (전체보기) Zoom을 x값 0에서 최대값 까지 볼수있게 함.
bool scrollFlag = true;
//차트를 클릭했을 때 처리 메소드
private void c_Click(object sender, EventArgs e)
{
if (scrollFlag == true)
{
t.Stop();
scrollFlag = false;
}
else
{
t.Start();
scrollFlag = true;
}
}차트를 클릭했을 때 차트를 멈추고, 진행하기를 실행하는 메소드입니다.
private void c_SelectionRangeChanged(object sender, CursorEventArgs e)
{
int min = (int)(c.ChartAreas[0].AxisX.ScaleView.ViewMinimum); //선택한 값의 가장 왼쪽이 미니멈
int max = (int)(c.ChartAreas[0].AxisX.ScaleView.ViewMaximum);
cursorX = min;
dataCount = max - min; //개수
}dataCount 를 지정해 한화면에 몇개의 dataCount를 볼지 정하는 메소드.
private void dataCountToolStripMenuItem_Click(object sender, EventArgs e)
{
dataCount *= 2;
}
private void dataCountToolStripMenuItem1_Click(object sender, EventArgs e)
{
dataCount /= 2;
}
private void speedToolStripMenuItem1_Click(object sender, EventArgs e)
{
speed *= 2;
}
private void speedDownToolStripMenuItem_Click(object sender, EventArgs e)
{
speed /= 2;
}속도 및 dataCount을 곱하기 or 나누기로 정하는 메소드.
//클릭하는 곳의 데이터 값을 표시
private void c_MouseClick(object sender, MouseEventArgs e)
{
HitTestResult htr = c.HitTest(e.X, e.Y);
if (htr.ChartElementType == ChartElementType.DataPoint)
{
t.Stop();
string s = string.Format(
"Count : {0}, ECG : {1}, PPG : {2}", htr.PointIndex,
c.Series["ECG"].Points[htr.PointIndex].YValues[0],
c.Series["PPG"].Points[htr.PointIndex].YValues[0]);
MessageBox.Show(s);
}
}가장 상단의 동영상 처럼 그래프를 클릭하면 값이 메세지 박스를 통해 출력된다.
HitTestResult형으로 HitPoint의 값을 찍어냄.(Point Index 이용)
using System;
using System.Collections.Generic;
using System.ComponentModel;
using System.Data;
using System.Drawing;
using System.IO;
using System.Linq;
using System.Text;
using System.Threading.Tasks;
using System.Windows.Forms;
using System.Windows.Forms.DataVisualization.Charting;
namespace _045_EcgPpg
{
public partial class Form1 : Form
{
double[] ecg = new double[100000];
double[] ppg = new double[100000];
private int ecgCount;
private int ppgCount;
Timer t = new Timer();
public Form1()
{
InitializeComponent();
this.Text = "ECG/PPG";
this.WindowState = FormWindowState.Maximized; //창 최대화
EcgRead();
PpgRead();
ChartSetting();
t.Interval = 10; // 0.01초
t.Tick += T_Tick;
}
private void PpgRead()
{
string fileName = "../../Data/ppg.txt";
string[] lines = File.ReadAllLines(fileName);
double min = double.MaxValue;
double max = double.MinValue;
int i = 0;
foreach (var line in lines)
{
ppg[i] = double.Parse(line);
if (min > ppg[i])
min = ppg[i];
if (max < ppg[i])
max = ppg[i];
i++;
}
ppgCount = i;
string s = string.Format("PPG: count = {0}, min = {1}, max = {2}",
ppgCount, min, max);
MessageBox.Show(s);
}
private void EcgRead()
{
string fileName = "../../Data/ecg.txt";
string[] lines = File.ReadAllLines(fileName);
double min = double.MaxValue;
double max = double.MinValue;
int i = 0;
foreach (var line in lines)
{
ecg[i] = double.Parse(line) + 3; //+3 해서 그래프를 따로 보기위함
if (min > ecg[i])
min = ecg[i];
if (max < ecg[i])
max = ecg[i];
i++;
}
ecgCount = i;
string s = string.Format("ECG: count = {0}, min = {1}, max = {2}",
ecgCount, min, max);
MessageBox.Show(s);
}
private void ChartSetting()
{
c.ChartAreas[0].CursorX.IsUserEnabled = true; // 커서 사용가능
c.ChartAreas[0].CursorX.IsUserSelectionEnabled = true; // zoom
c.ChartAreas[0].BackColor = Color.Black;
c.ChartAreas[0].AxisX.Minimum = 0;
c.ChartAreas[0].AxisX.Maximum = ecgCount;
c.ChartAreas[0].AxisX.Interval = 50; //50개의 데이터마다 새로운 눈금을 그림
c.ChartAreas[0].AxisX.MajorGrid.LineColor = Color.Gray;
c.ChartAreas[0].AxisX.MajorGrid.LineDashStyle = ChartDashStyle.Dash;
c.ChartAreas[0].AxisY.Minimum = -2;
c.ChartAreas[0].AxisY.Maximum = 6;
c.ChartAreas[0].AxisY.Interval = 0.5;
c.ChartAreas[0].AxisY.MajorGrid.LineColor = Color.Gray;
c.ChartAreas[0].AxisY.MajorGrid.LineDashStyle = ChartDashStyle.Dash;
c.Series.Clear(); // 시리즈를 다 지운다
c.Series.Add("ECG");
c.Series.Add("PPG");
c.Series[0].ChartType = SeriesChartType.Line;
c.Series[0].Color = Color.LightGreen;
c.Series[0].BorderWidth = 2;
c.Series[0].LegendText = "ECG";
c.Series[1].ChartType = SeriesChartType.Line;
c.Series[1].Color = Color.Orange;
c.Series[1].BorderWidth = 2;
c.Series[1].LegendText = "PPG";
// 데이터를 시리즈에 넣는 작업
foreach (var v in ecg)
{
c.Series["ECG"].Points.Add(v);
}
foreach (var v in ppg)
{
c.Series["PPG"].Points.Add(v);
}
}
	private int cursorX = 0;  // 차트에 표시되는 첫번째 데이터
        private bool scrolling = false;  // true이면 스크롤, false이면 정지
        private int dataCount = 50;  // 한 화면에 표시되는 데이터
        private int speed = 2;  // 데이터 표시 속도
 private void T_Tick(object sender, EventArgs e)
        {
            if (cursorX + dataCount <= ecgCount)
                c.ChartAreas[0].AxisX.ScaleView.Zoom(
                cursorX, cursorX + dataCount);
            else
                t.Stop();
            cursorX += speed;
        }
  private void viewAllToolStripMenuItem_Click(object sender, EventArgs e)
        {
            t.Stop();
            c.ChartAreas[0].AxisX.ScaleView.Zoom(0, ecgCount);
            scrolling = false;

        }

        private void exitToolStripMenuItem_Click(object sender, EventArgs e)
        {
            this.Close();
        }

        private void autoScrollToolStripMenuItem_Click(object sender, EventArgs e)
        {
            t.Start();
            scrolling = true;
        }
bool scrollFlag = true;
        //차트를 클릭했을 때 처리 메소드
        private void c_Click(object sender, EventArgs e)
        {
            if (scrollFlag == true)
            {
                t.Stop();
                scrollFlag = false;
            }
            else
            {
                t.Start();
                scrollFlag = true;
            }
        }
 private void c_SelectionRangeChanged(object sender, CursorEventArgs e)
        {
            int min = (int)(c.ChartAreas[0].AxisX.ScaleView.ViewMinimum); //선택한 값의 가장 왼쪽이 미니멈
            int max = (int)(c.ChartAreas[0].AxisX.ScaleView.ViewMaximum);
            cursorX = min;
            dataCount = max - min; //개수
        }
private void dataCountToolStripMenuItem_Click(object sender, EventArgs e)
        {
            dataCount *= 2;
        }

        private void dataCountToolStripMenuItem1_Click(object sender, EventArgs e)
        {
            dataCount /= 2;
        }

        private void speedToolStripMenuItem1_Click(object sender, EventArgs e)
        {
            speed *= 2;
        }

        private void speedDownToolStripMenuItem_Click(object sender, EventArgs e)
        {
            speed /= 2;
        }
//클릭하는 곳의 데이터 값을 표시
        private void c_MouseClick(object sender, MouseEventArgs e)
        {
            HitTestResult htr = c.HitTest(e.X, e.Y);
            if (htr.ChartElementType == ChartElementType.DataPoint)
            {
                t.Stop();
                string s = string.Format(
                    "Count : {0}, ECG : {1}, PPG : {2}", htr.PointIndex,
                    c.Series["ECG"].Points[htr.PointIndex].YValues[0],
                    c.Series["PPG"].Points[htr.PointIndex].YValues[0]);
                MessageBox.Show(s);
            }
        }
}
}전체 소스코드
'C#' 카테고리의 다른 글
| 047_Form_Clock_C# (0) | 2022.06.09 |
|---|---|
| 046_Matching Game(그림 맞추기 게임)_C# (0) | 2022.06.09 |
| 044_Graph (0) | 2022.06.09 |
| 043_TwoChart (0) | 2022.06.09 |
| 042_Chart (0) | 2022.06.09 |